
Sight
FinTech hackathon · Live demo ready

Predictive liquidity for fintech treasury.

A five-model ML ensemble forecasts every account fourteen days ahead, raises alerts before deficits happen, and explains each prediction with gpt-4o-mini.

AI Co-pilot, not Autopilot · Human-in-the-loop by design
sight.app · /dashboard
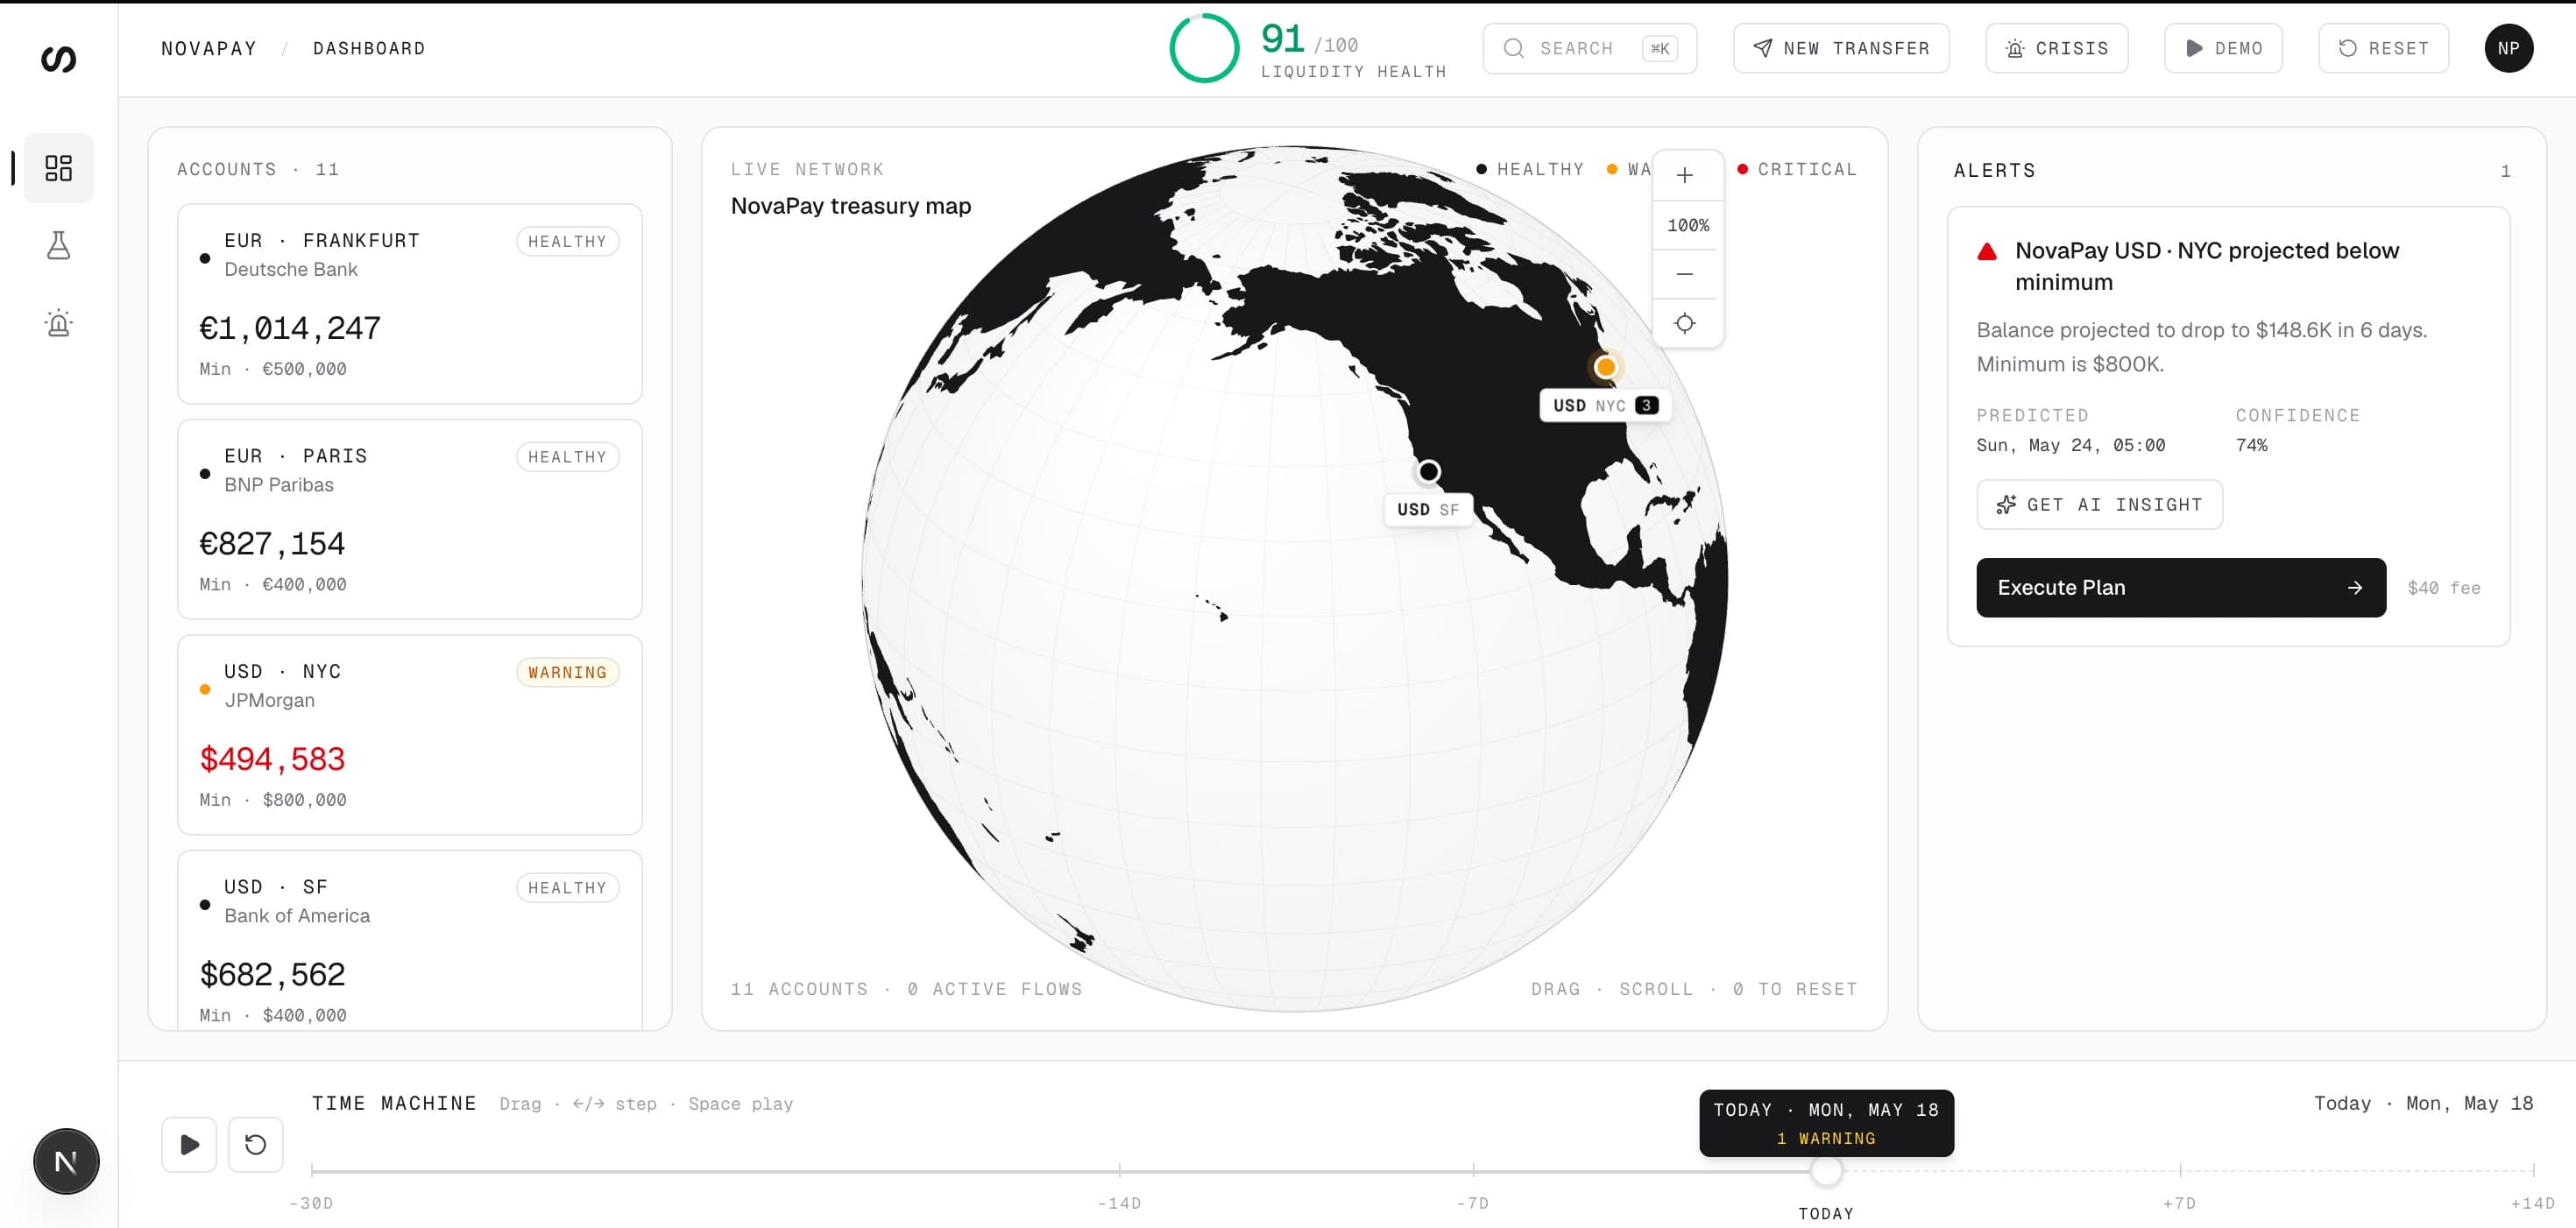
Sight dashboard preview

Built with the actual ML & frontend stack

  • Next.js
  • Python
  • Prophet
  • LightGBM
  • ARIMA
  • Chronos
  • OpenAI
  • Vercel
What Sight actually does

Treasury teams react to liquidity crises. Sight predicts and resolves them.

A fintech treasury team manages dozens of accounts across currencies and banks. Clearing delays cause cash gaps. To stay safe they freeze millions in idle reserves. They notice problems only after they happen, then scramble to rebalance.

Sight gives them a forecast, a reason, and a fix — for every account, every day, in real time. Four steps below.

01Time Machine

See what hasn't happened yet

Drag Time Machine. Every account balance, every status colour, every alert recomputes from real ML predictions fourteen days ahead. USD-NYC is fine today, $150K below minimum on day five — you watch it happen.

02Predictive alerts

Catch the risk before it happens

Auto-generated alerts the moment a forecast dips below an account minimum. Severity escalates with how low the dip goes. No manual monitoring of eleven accounts across five currencies.

03AI insights

Understand why in plain English

Click any alert, get a 2-sentence explanation from gpt-4o-mini using the actual forecast numbers. Why the dip is happening, when it bottoms out, and what to do about it.

04One-click resolution

Resolve in one click

Sight Compass finds the optimal donor account, picks SEPA or SWIFT based on currency pair, sizes the transfer to cover the deficit plus a 20% buffer, executes it. Balance restored, forecast cleared.

0
overdrafts on backtest
all 224 caught early
−47%
frozen reserves
fewer just-in-case buffers
−80%
treasury hours
from manual monitoring
Why Sight exists

Treasury failures are predictable. We just don't watch them.

Every major treasury blow-up of the last decade — SVB, Credit Suisse, Synapse, the London Whale — shared the same pattern. A risk was visible in the data. Nobody had the tools to see it in time.

Sight is built directly against this pattern. Each feature below is a response to a documented failure, grounded in the same industry research that treasury benchmarking firms publish every year.

$150T+
Annual B2B payment flows
McKinsey · Capgemini
$5-6B
Treasury Management Software TAM
Verified Market Research 2025
10-25%
Working capital frozen as buffer
Deloitte Treasury Survey
#1+#2
Forecast accuracy & Excel — top pains
PwC Treasury Benchmarking
Each Sight feature is a response to a real failure
2023$200B+ deposits

Silicon Valley Bank collapse

Overnight illiquidity. Many fintechs held 80%+ of cash in a single counterparty.

Sight's answer

Concentration Card (HHI) — tracks share of portfolio in any one bank.

2024$85M+ in limbo

Synapse bankruptcy

Banking-as-a-service ledger discrepancies. Internal records desynced from real correspondent balances.

Sight's answer

Versioned JSON contract between ML and UI. Conformal P10/P90 instead of point estimates.

2023$1.6T balance sheet

Credit Suisse emergency rescue

Counterparty risk materialized worldwide. Treasurers had hours to reposition.

Sight's answer

Counterparty dimension in HHI. Roadmap: contagion graph for second-order exposures.

2012$6.2B trading loss

JPMorgan London Whale

Excel copy-paste error in VaR model. Risk math used sum instead of average — passed review.

Sight's answer

Liquidity Gradient solver in typed code. No Excel. All math is tested and versioned.

SourcesMcKinsey Global Payments Report · Capgemini World Payments Report · PwC Global Treasury Benchmarking Survey · Deloitte Global Treasury Survey · Verified Market Research Treasury Management Systems Report 2025. Incident details from SEC filings, FDIC receivership reports, FRB post-mortems, and public investigative journalism.
How it works

Train once offline. Serve forecasts instantly forever.

Transactions365 daysSelectionOOF holdoutforecasts.json14 days
Prophet
LightGBM
ARIMA
Holt-Winters
Chronos
Step 1

Transaction history

365 days of NovaPay transactions across 11 accounts. Clearing delays, holidays, weekly cycles — all encoded.

Python · pandas
Step 2

Ensemble training

Five ML models train in parallel: Prophet, LightGBM with quantile loss, ARIMA, Holt-Winters ETS, Amazon Chronos.

scikit-learn · lightgbm · prophet · transformers
Step 3

Forecast export

Stacked Ridge meta-learner picks optimal weights per account. Output: a static forecasts.json with 14-day predictions.

joblib · numpy
Step 4

Live dashboard

Next.js reads the JSON, renders the 3D globe, Time Machine slider, alerts, and AI insights — no backend, no Python at runtime.

Next.js · cobe · OpenAI
The ensemble

Five forecasters with different specialities. One meta-learner decides who to trust.

Prophet

#3
Facebook · 2017

Trend, weekly seasonality, country holidays

Holdout MAPE5.34%

LightGBM

#6
Microsoft · 2017

Cross-account features, lag interactions, payday cycles

Holdout MAPE8.61%

ARIMA

#4
Classical · 1970s

Short-term autocorrelation

Holdout MAPE6.81%

Holt-Winters

#5
Classical · 1960s

Exponential smoothing with trend + seasonal

Holdout MAPE8.06%

Chronos

#1
Amazon Science · 2024
transformer

Foundation model, patterns from millions of time series

Holdout MAPE3.35%
Per-account selection

Best model picked from honest OOF holdout

Ridge stacker is trained on rolling-origin out-of-fold predictions (5 windows × 7 days = 35 OOF pairs per account) and evaluated on a separate held-out test window. For each account we then pick the lowest-MAPE candidate — base model or stacker.

Chronos 9 · Ridge stacker 1 (volatile USD-NYC) · Prophet 1
Sight MAPE · 7d5.51%
Real backtest results

Numbers from an actual walk-forward backtest. Not marketing.

Thirty walk-forward cutoffs over 365 days of history. Trained on data before each cutoff. Predicted what happened after. Compared against three baseline forecasters. Every digit on this page is reproducible from public/data/backtest_results.json.

3-day MAPE
4.98%
vs naive 11.29%
14-day MAPE
5.24%
vs naive 9.23%
Deficit detection F1
1.00
all shortfalls caught
Forecast horizon
14.00d
per account, per day

MAPE by horizon · lower is better

Sight vs naive
1 day
5.06%5.48%
3 days
4.98%11.29%
7 days
5.51%6.45%
14 days
5.24%9.23%
Sight winsall 4 horizons
across 1d, 3d, 7d, 14d
Per-accountmodel selection
best model picked from holdout
5-fold OOFrolling-origin
walk-forward, honest test
P10 – P9076% / 80% target
time-weighted split conformal, held-out coverage

Customer development

Three treasury roles, three concrete pains.

Composite quotes synthesized from CustDev conversations and secondary research (PwC, Deloitte). Anonymized by design — each persona maps to a real role, a real corridor, and a specific Sight feature.

Reconciling nostro balances and SWIFT confirmations in Excel takes my team two business days a week. When our USD balance in New York drops below the floor, we learn about it from a bank email — that's six to eight hours of scramble and sometimes regulator-facing penalties.
CF
CFO
Mid-market FinTech · KZT/USD corridor
Pain
Manual reconciliation + reactive alerts
Sight's answer
Real-time globe + computed alerts ahead of the dip
Predictions + explanations

ML predicts the number. GPT-4o-mini explains why.

request · live OpenAI callLive
POST/api/insights
accountId"usd-nyc"
dayOffset5
context"crisis: swift-outage"
model: gpt-4o-mini
temperature: 0.4
max_tokens: 250
AI649 tokens · 1.2s

The account balance is forecasted to drop to $150,233 by May 23, which is significantly below the required minimum of $800,000. This stems from cumulative low forecasted balances on May 22 ($244K) and May 23 ($150K). To mitigate, consider increasing liquidity through funding or reducing outflows before these dates.

Why the model predicted this · SHAP top factors
Recent 7-day trend
-$82K
Monthly cycle
-$47K
Payday approaching
+$22K
Pending SWIFT inflows
+$15K
Beyond prediction · Allocation

Predicts shortfalls. Then solves them in one click.

pressure model · liveGradient
# urgency-weighted deficit
pressure(a) = Σd∈[0,14] max(0, mina − bala,d) · wd
# supply & flow
supply(a) = mind(bala,d − mina)
flow: argmax(pressure) ← argmax(supply)
Computed pressure · top 1
USD · NYC
+12d · 38,484,921
iter: 1 / 40
converged at: 1 transfers
runtime: 1ms
Optimizer1 transfers · $25 fees · 0 deficits
Pressure mapbefore · after
USD · NYC100 0
EUR · Frankfurt0 0
EUR · Paris0 0
USD · SF0 0
GBP · London0 0
Computed plan · execute top-down
  1. 1
    FX HedgingUSD · NYC
    Lifts NYC above min on day +12
    $471.1K
    SWIFT
One click compresses ~6h of treasury workRun in demo
What we built with

Standard tools. No magic. No vendor lock-in.

ML pipeline

  • Python 3.13runtime
  • Prophet 1.1trend + seasonality
  • LightGBM 4.6gradient boosting
  • statsmodels 0.14ARIMA + ETS
  • Chronos-T5Amazon foundation model
  • scikit-learn 1.4Ridge stacker
  • SHAP 0.51feature explanations
  • pandas + numpydata

Frontend

  • Next.js 16App Router
  • React 19UI
  • Tailwind CSS 4styling
  • Motionanimations
  • cobe3D globe canvas
  • Rechartscharts
  • cmdkcommand palette
  • Zustandstate

AI insights

  • AI SDK v6Vercel SDK
  • @ai-sdk/openaiprovider
  • gpt-4o-miniOpenAI
  • Zodschema validation

Hosting

  • Vercelsingle deploy
  • Fluid ComputeNode.js runtime
  • Vercel CDNstatic JSON